Solar energy conversion
Manual of Experiment
The goal of the experiment "Solar energy conversion" is to get acquainted with its course and measure the I-U characteristic of a photovoltaic cell in the dark and under illumination.
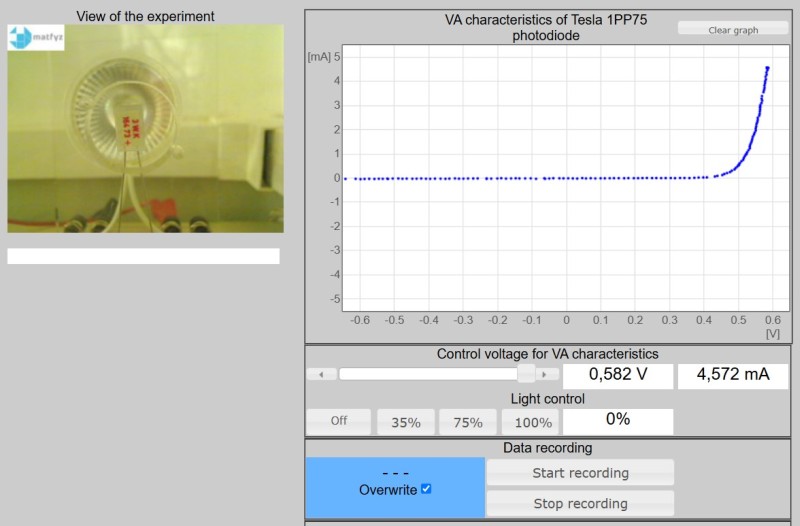
After a while after clicking on the "Start experiment" button, the experiment page will appear (Fig. 1). Please be patient until you are connected to the experiment and all the necessary data is loaded. If someone is measuring at that time and the experimental apparatus is occupied, please wait 5 minutes. The reservation system is being prepared and will be launched shortly.

Fig. 1 Home web page of the experiment "Solar Energy Conversion"
Take a close look at the web page you are on:
Active camera
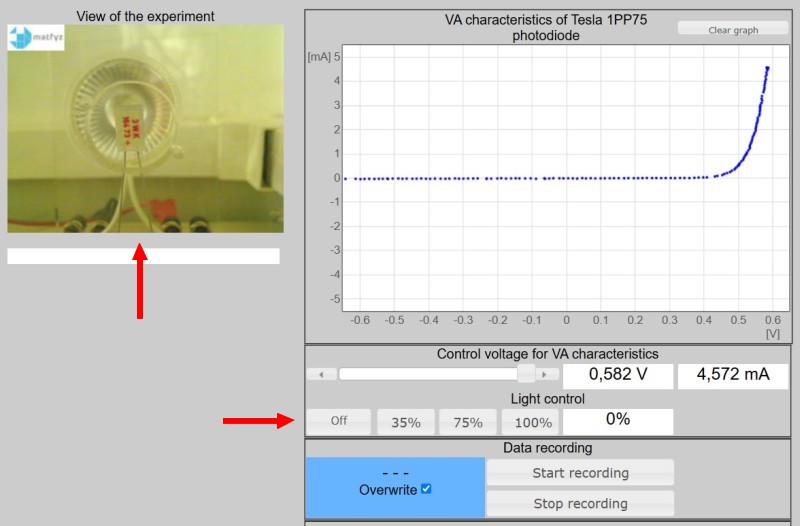
Allowing an online view of the experiment, located in the laboratory of the Department of Physics Didactics, MFF KU in Prague; with two resolutions (i.e. with different data transfer requirements) and the option to turn off the camera. Higher resolution allows you to increase the number of transferred data. Choose one of them. Do you see the difference at the given resolutions?radiation intensity
The WWW page allows you to control the experiment by changing the intensity of the source radiation (which in the case of measurements in the laboratory replaces the Sun) falling on the photovoltaic cell. Set the radiation intensity. You can set the intensity using four discrete values by pressing the buttons marked 35 %, 75 %, 100 % and the Off. indicator light (Fig. 2).

Fig. 2 View of the website "Solar energy conversion" with the camera and radiation intensity marked
Measurement of I-U characteristics
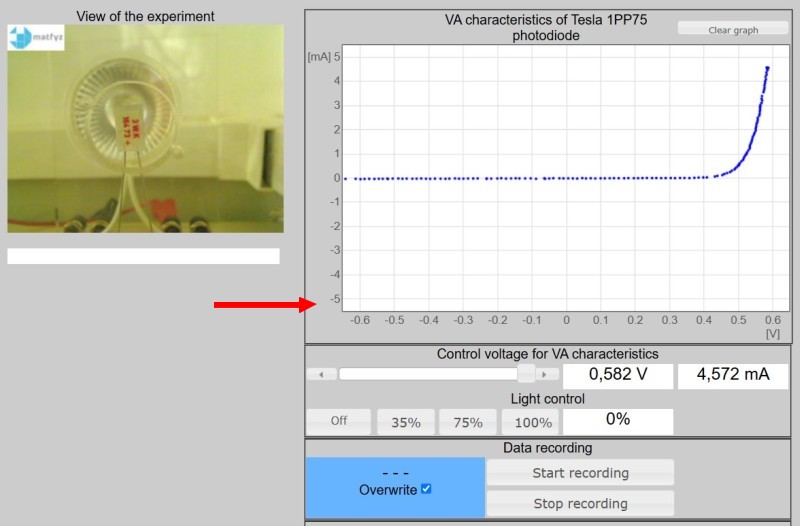
The voltage on the cell can be set by connecting the movable button in the allowed interval of values from -0.5 V to +0.5 V and at the same time the voltage U and current I are displayed on the screen (see Fig. 3), while the individual points of the I-U characteristic are gradually visible. View the I-U characteristic with the source turned off. You can delete the graph using the "Delete graph" indicator

Fig. 3 Website "Solar energy conversion" with the measured points of the I-U characteristic marked in the dark
Observe the change in the I-U characteristic with a change in radiation intensity L – 0.35 L, 0.75 L and 1.0 L.
